This is one article in a collection of 52 articles published weekly throughout 2023 on the basics of Bitcoin. The series is intended for people unfamiliar with Bitcoin or people wishing to enhance their understanding of the fundamentals that underpin the technology. Please contact us, if you have any questions or comments.
The bitcoin halvings have created a phenomenon known as the bitcoin market cycle. While the price of bitcoin has certainly fallen significantly since its all-time high, it is perhaps best to view bitcoin through the lens of the four-year halving cycles when analyzing the price fluctuations. The chart below looks at the price lows and highs during each four-year cycle.
| Period | Low Price | High Price |
| 01/03/2009 – 11/28/2012 | $0 | $31.90 |
| 11/29/2012 – 07/09/2016 | $12.40 | $1,241.90 |
| 07/10/2016 – 5/11/2020 | $471.40 | $19,870.60 |
| 05/12/2020 – present | $8,865.30 | $68,990.60 |
While there are only four data points for lows and highs as a result of three halvings occurring to date, the pattern is higher lows and higher highs with each successive halving. This is in part due to the supply being cut in half with the halving (hence the name) but also due to bitcoin being owned by more and more individuals around the globe. The halving of the supply every four years along with the continued adoption as more and more utilities for Bitcoin have come to fruition has led to a continued increase in the price with each halving despite the price of bitcoin falling dramatically during the bear market portions of the four-year cycles. Studying the four year cycles centered around the halving events provides useful information.
The chart below illustrates the lows and highs during the calendar years since bitcoin’s inception:
| Year | Low Price | High Price |
| 2010 | $ - | $ 0.50 |
| 2011 | $ 0.30 | $ 31.90 |
| 2012 (halving) | $ 3.90 | $ 15.40 |
| 2013 | $ 13.20 | $ 1,241.90 |
| 2014 | $ 91.70 | $ 1,093.40 |
| 2015 | $ 157.30 | $ 492.80 |
| 2016 (halving) | $ 350.40 | $ 982.60 |
| 2017 | $ 739.50 | $ 19,870.60 |
| 2018 | $ 3,177.00 | $ 17,252.80 |
| 2019 | $ 4,070.50 | $ 13,929.80 |
| 2020 (halving) | $ 3,869.50 | $ 29,298.80 |
| 2021 | $ 28,204.50 | $ 68,990.60 |
| 2022 | $ 15,711.00 | $ 48,199.00 |
| 2023 | $16,605.10 | $30,222.20 |
The price of bitcoin has been extremely volatile throughout bitcoin’s history. However, the price of bitcoin has increased exponentially with each halving. When looking at the price of bitcoin, following the day-to-day fluctuation is a fool’s errand. One could argue a more prudent way to examine the price is based on the Bitcoin protocol’s scheduled halving cycles.
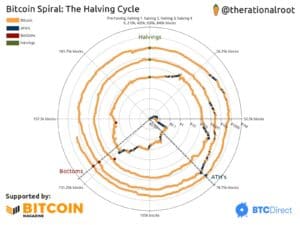
One interesting way people, including twitter user @therationalroot, have begun viewing the halving cycles is in terms of a clock. Remember a halving occurs every 210,000 blocks (approximately every four years). Viewing the halving cycles as a clock is useful for viewing where the tops and bottoms of each of the halving cycles to date have occurred in previous cycles.

The next halving is scheduled to occur again around May 2024.

